As a follow up to our Q3 2020 newsletter article “Business Intelligence for You”, we wanted to provide an update on our exciting initiative, Insights by Axletree – our BIaaS system that makes complex data simple. Watch this video for a brief narrated tour of the interface and some sample analytics it can provide you and your business:
Complex Data
We see Business Intelligence as more than just the dashboard, widgets and colorful data charts. While it is key that the visual representations are appealing and easy to use, they must also bring value to users, allowing them to take quick and decisive action based on the complex data that they represent. We can derive value from large and unorganized data sets by using systems that sort and analyze this information using predetermined metrics. While it’s easy to get lost in the weeds with all this information, at Axletree we have adopted a methodology for handling data that is simple and effective, through asking four key questions:
- What is it?(I.e. the data, the subject matter)
- Where is it?
- How much is it?
- Is there a trend that can be applied to it?
With this methodology, we remove the complexity of the data, creating clean and organized business intelligence that our clients can use to inform decision-making and drive their organizations forward.
Within the business world, there exists an abundance of information that can be leveraged to provide actionable intelligence for any organization. Within the Axletree marketplace, this includes data across our payments integration, messaging, treasury, compliance and finance verticals. Our team of business and data analysts are constantly evaluating complex data to determine how we may continually grow the BIaaS (Business Intelligence as a Service) library and increase the value proposition of the service for our clients.
How are we building our business intelligence library?
1. Firstly, we listen:
We listen to our clients when they discuss challenges they face in attempting to predict future business trends, such as:
a)Messaging volume trends
b) Geographic distribution of liquidity
c) Cash forecasting analytics
d) Geographic distribution of banking relationships
2. We understand:
Our team of business and data analysts understand and can analyze the data elements required to create robust analytics. Our team can also configure the service to meet the business intelligence needs of each individual client.
3. We are Data Source Agnostic:
We have created a Data Source Agnostic Environment – this means that data can be harnessed from any structured or unstructured data source that exists within the Axletree private cloud. This provides opportunities to cross–pollinate data between data sources, creating analytics that provide a 360° view of all transactional data within the Axletree marketplace.
4. We use Predictive Analytics:
We have implemented machine learning algorithms such as Auto-Arima, Holt-Winters and Prophet to provide robust predictive forecasting analytics.
5. We configure:
We believe that any business intelligence platform should be predominantly configuration–based, thus significantly reducing the time and effort involved in establishing a value–added analytics service. We have adopted this principle to allow for quick and efficient implementation of actionable intelligence.
6. We are Client-focused:
We have created customer–centric analytics which are easy to use, including a multi-level drill down, machine learning & artificial intelligence, and drag & drop capabilities.
Let us review a few examples of Insights in action from within the Axletree payments vertical.
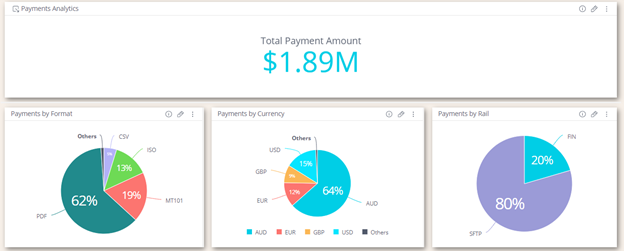
The What:
This example displays the total payments processed within a given timeframe. This includes additional supporting analytics by payment rail, payment format and payment currency.
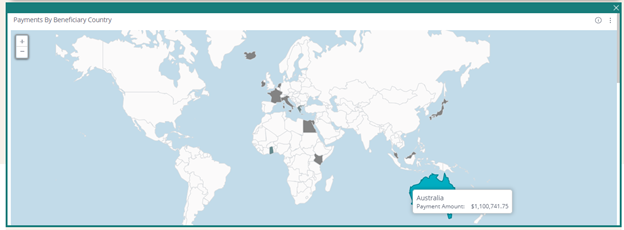
The Where:
This displays the geographical disbursement of the payments based on the beneficiary countries.
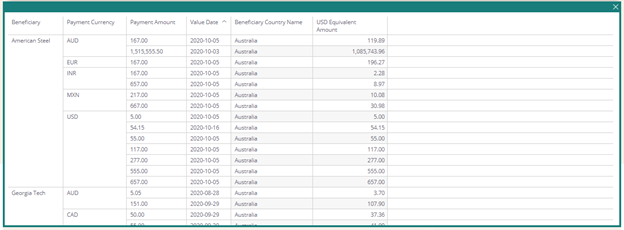
How much:
This displays a breakdown of the payment amounts to each beneficiary within the selected country.
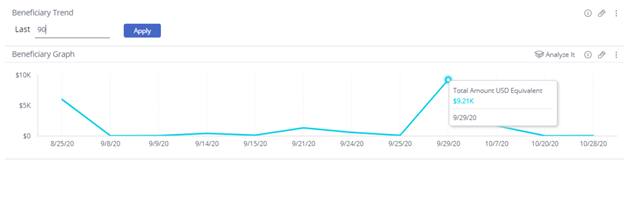
The Trend:
This graph displays the trend of payment activity for a given beneficiary over a selected time horizon.
Learn more about Insights by Axletree.